[ad_1]
The past two and a half decades have been good for big business. While the size of the private sector as a percentage of OECD economies has held relatively steady since the mid-1990s, the share of companies with more than $1bn in annual revenue has grown by 60 per cent since 1995. The big have got bigger, and the rich have got richer. But behind that headline trend, there is a great deal of geographic and socio-economic nuance, as a new McKinsey Global Institute white paper shows.
Researchers examined the economic contributions of both private and public companies in rich countries over the past 25 years. Reading the paper, I was struck by five key lessons for policymakers and corporate leaders which should inform the debate over the role of corporations in society.
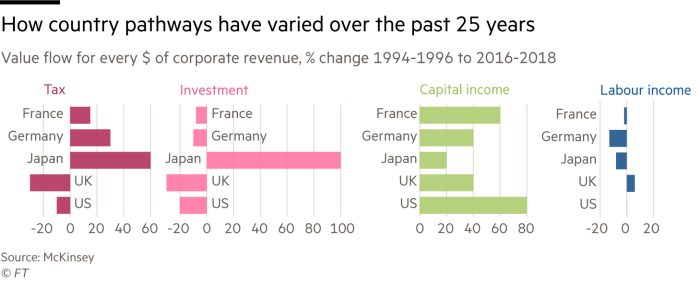
First, the losses suffered by labour relative to capital are even more extreme than previously thought. While productivity gains since the mid-1990s amounted to 25 per cent in real terms, wages grew only 11 per cent. Meanwhile, capital income increased by two-thirds. If there is any doubt that the link between productivity and wages has broken down, this should put it to rest.

That strengthens the argument for a much broader sharing of capital wealth. Right now, the top 10 per cent of households in the US own 87 per cent of equities. “It’s crucial that we have more people participating in the capital income pathway,†says MGI director James Manyika, “because while labour income remains the most important for the majority of people, capital income is a bigger and bigger part of where value is going.â€
Companies could offer equity ownership to more, or even all, employees. But the public sector could also tax corporate equity wealth, something proposed recently by the University of California, Berkeley economists Emmanuel Saez and Gabriel Zucman. Or it could pay out a digital dividend to individuals that represents a share of the data wealth gathered by the largest, richest companies, notably the Big Tech platforms.

This points to another key lesson: the intangibles rule. Of all the ways in which companies can have an impact on the economy — from wages and the taxes that they pay, through the consumer surpluses they generate with cheaper prices, to negative externalities such as environmental spillovers — the one that has grown most sharply over the past 25 years is investment in intangible assets such as technology, software, patents and so on. This is up by 200 per cent. It makes companies more productive, but is also associated with jobless recoveries in the short to midterm — a significant political concern.
That brings me to lesson three, which is that different types of companies have very different impacts on households and economies. The MGI paper divides corporations into eight archetypes: discoverers (for example, biotech firms, which push scientific frontiers); technologists, including the platforms that build the digital economy; experts (professional services, hospitals and universities); deliverers, which distribute and sell products; makers (manufacturers); builders; fuellers; and financiers.
For most of the 20th century, makers and builders were pre-eminent. Over the past 25 years, they lost ground to the other archetypes. While makers represented 56 per cent of large companies in the data set in 1995, they accounted for only 41 per cent by 2016-2018. But as they decline, so does good employment. Makers contribute 20 per cent more than average to labour income, employ the most people and have the widest geographic distribution of value thanks to their supply chains and need for physical space and investment into tangible goods.
No wonder they are at the centre of the national competitiveness debate. Some countries, such as Japan and Germany (where makers haven’t declined at all), have made specific policy decisions to support them. Others, like the US and the UK, have not to the same extent.
This is lesson four: countries have very different corporate interests. Technologists are driving the US and South Korea, while makers rule Germany. Financiers lead in the Netherlands and France is all about discoverers and deliverers, most notably in the luxury goods sector.
While the study doesn’t specifically examine small and midsized companies, it does hint at hard times for them. Big companies are paying less as a percentage of revenue to their suppliers now than they did 25 years ago, and many of those suppliers are SMEs. Given that such companies are quite labour-intensive, usually more so than large ones, that has important social and political implications.

Which brings me to the final lesson: competition matters. We know that we are living in a superstar economy. That is in many ways the natural result of globalisation, financialisation and the rise of the platform giants, which are under fire around the world because of the monopoly power they exercise. Large companies, particularly in the US, have been the biggest economic winners of the past quarter of a century.
But for the business sector to enjoy another 25 years of unfettered growth, it will need to show that it can enrich a broader range of stakeholders. The consumer surplus driven by lower prices on the products and services created by technologists and makers aren’t fully compensating for job losses due to automation. High income households, particularly in the US, are taking the lion’s share of business wealth.
The past 25 years have shown that business can generate a tremendous amount of wealth. The next 25 must show that it can share that wealth more equally.
[ad_2]
Source link


